About Tom Clouse

I am a writer, researcher, editor and big fan of ancient Chinese philosophy and online courses in everything. I can be reached by email at thomas.clouse@rukuku.com

Another Slice of PISA: Socioeconomic factors weigh heavily on US students’ test scores

I wrote about the OECD’s annual standardized test earlier this week, the PISA (Programme for International Student Assessment), and today I am going to write about it again. Repetition is the key to these standardized tests, you know. In this particular post, I’d like to take a look at a few of the more subtle details from the report released by the OECD together with the results.

PISA, OECD, socioeconomic status, education

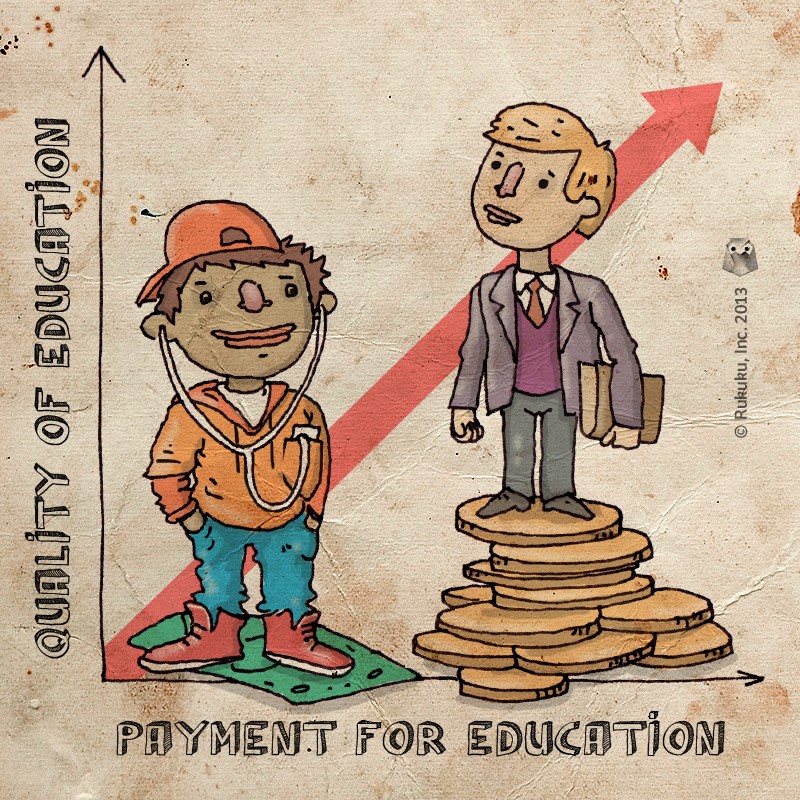
The OECD’s PISA test shows that socioeconomic factors strongly influence educational outcomes.

The first of those details is a big one because it relates to money.  According to the OECD’s report, socioeconomic differences account for a 15% variance in the testing outcomes in the US, compared to less than 10% in Finland, Norway, Japan, and Hong Kong. In other words, two students from different socioeconomic backgrounds are more likely to perform differently on the PISA in the US than in most other OECD countries. And it is not the student on the lower end of the financial spectrum that performs best.

Also, the OECD has a special classification for super rad students that are among the lowest 25% socio-economically but still perform in the top 5% academically. They are called “resilient.” In the US, only 5% of low income students classify as resilient, compared to 7% on average and around 15% for Hong Kong, Macao, Shanghai, and Vietnam.

This seems like it should be a strong point for the US. American dream, social mobility, all that, but as it turns out, it is the opposite. Ironically, unlike many other countries, the US does not show a big difference in the student-teacher ratio or teacher education levels in lower performing schools. So what is that difference? Facilities maybe? After school programs?  I’d be very interested to hear any ideas in that big comment box below.

In terms of school performance, some interesting results came up as well. First, across all the OECD countries, schools with more autonomy tended to perform better. So, the more control the principal had, when combined with accountability measures and strong principal-teacher interaction, the better the students did.

At the same time, there was no cross-country evidence that competition among schools in any way contributed to better student performance. In other words, students at schools that compete to enroll more kids performed at the same level as students that are pretty much stuck with their schools.

On the positive side, or not really, the US did score well in opinions about our own math skills. This comes despite a below average ranking in math. For example, 69% of respondents felt confident in their ability to calculate figures such as the gas consumption rate of a car. The OECD average was 56%. So, at least we are confident. And have warning lights for low fuel.

U. S. Ain’t: The US shows no progress in international education test

The world is ending. Or at least it is in America. Or at least it is in American schools. After years and years of bold educational reforms, 15 year-olds in the US scored just about where they always have, when compared to students in developed countries around the world: about average in reading and science, lower in mathematics.

US education. PISA, OECD

Despite years of reform, the US continues to perform poorly on the OECD’s PISA test.

Surprising no one, students in East Asian countries knocked it out of the park, and those in Europe did pretty well, too. Meanwhile, among the 34 OECD countries, the US scored 17th in reading, 21st in science, and 26th in math. The margin of error is about three there, for all the optimists and pessimists out there.

The poor performance comes despite spending a ton of money. Among all the countries surveyed, the US had the third highest per capita income, and only Austria, Luxembourg, Norway, and Switzerland spend more per student. To illustrate, the Slovak republic spends around $53,000 per student and performs at the same level as the United States, which spends $115,000. Yikes.

And yea, it gets worse. The US did particularly poorly in measures of critical thinking. Things like, applying mathematics to real world problems. This is supposed to be our strong point. Or at least that’s what I always thought. Like, maybe we drop out of school like Bill Gates, but we still think outside of the box and all that. These test results seem to indicate otherwise.

Of course one might wonder how a standardized test can legitimately measure a student’s ability to think critically. For example, a student with strong critical thinking skills might realize that there are few personal rewards for doing well on these tests.

But then, maybe that attitude is just the problem, a reflection of our American individualist way of looking at life. I am not going to get into all that now, other than to say I always tried my best on standardized tests.  I promise.

So, what next? The OECD says that the Common Core standards should help. We’ve discussed those standards in our blog here and plan to discuss them more. One of the main selling points of Common Core standards is that they emphasize critical thinking. It is tough to prove that one way or the other, especially when standardized tests are actually “the box”, in that “think outside the box” metaphor. But it will be interesting to see.

We will dive into these results a bit more in the next blog post. Meanwhile, don’t lose heart. We still have Bill Gates, Warren Buffet, and Bob Dylan.

The Common Core and Its Many Colors

Henry Ford once said that any customer could have a car painted any color he liked as long as it was black. Many opponents of the Common Core standards see policymakers giving teachers a similar offer. Teach whatever you want as long as it is the Common Core. Proponents say the standards set broad goals and give freedom to teachers to employ their own methods toward reaching those goals.  Critics say they box teachers in, preventing them from adjusting their class material to the needs of their students.

Common Core

How much freedom does Common Core give for teachers to teach?

The basic idea behind the Common Core is that students around the country should study similar topics at similar times.  For example, all students should study subtraction in the second grade and past tense verbs in fourth.—Disclaimer: I am making these up for the sake of illustration. I am already too far behind schedule to read through all the standards. Anyway, the point is, all the teachers have the same goals and can use various methods to reach those goals.

Proponents of the standards see them as key to equalizing educational experiences and educational opportunities around the country.  It doesn’t seem fair that students in rural Kentucky wouldn’t get opportunities to study the same material as the students in New York City. Or vice versa. Common Core material also prepares students for SAT and ACT college entrance exams. By making sure all students cover the same material, Common Core proponents are hoping to level the playing field.

That approach may ignore circumstances, however, which require teachers to slow down and make sure students understand the material. Students in low income areas, for example, or whose first language is not English, may not be ready to study the same topics as students in an upper class suburban neighborhood.

Further complicating things, the combination of the Common Core and the No Child Left Behind policy produces a whole lot of tests. Those test results significantly influence a teacher’s future. Weighing those test results too heavily would reward a teacher for effectively teaching test-taking skills, but not necessarily being good teachers. In this sense, like Henry Ford’s offer, teachers can teach anything they want as long as it is the stuff on the tests.

Let me throw out a hypothetical here: What if a teacher has to spend extra time helping students learn to play well together? Seriously, I’m not joking. Students from rough backgrounds often need time to learn to get along better with each other. That is a valuable, life-long skill. And hats off to a teacher that can actually teach that. But will it help on those dang test scores? Probably not. And if so, maybe not until a few more years down the road.

I mean, surely it is not bad to have some general direction on what to teach in class and occasional measures of effectiveness in teaching that material. The problem is, it is tough to properly measure all the many roles that teachers perform. The most profound ways in which teachers influenced me were only loosely related to coursework. So how can we measure the importance of a teacher that inspires children to travel, to help others, to be good friends and neighbors?

I don’t have the answer for that, but I am very interested to know what our readers think. How can you judge the effectiveness of teachers when they are expected to perform so many different roles?  And how much flexibility should teachers have in determining the academic material covered in class?

Free your mind – The push for cheaper textbooks

As anyone who reads this blog knows, the cost of education is an important topic for us. One of our goals is to expand the number of education options for everyone in the entire world. Lots of people are trying to do similar things, especially those in the movement to have more open source educational material.

Textbooks, Senate, Cost of Education

Senators propose public funding for free textbook creation.

Those folks are getting some support from two US senators. Senator Dick Durbin of Illinois and Senator Al Franken of Minnesota have proposed a bill to offer public funding for the creation of education textbooks on the condition that the material then be offered free of charge.

Here’s what Senator Franken said about the bill.  “I’m proud to introduce this bill because it will help provide cheaper alternatives to traditional textbooks and keep more money in students’ pockets, where it belongs.” Here is what Al Franken said when he used to be an actor on Saturday Night Live. I bet he’s proud of that, too.

Textbook costs are more significant than one might think. The average student at a four year public university spends about $1200 per year on textbooks, according to the College Board. Since 1978, the cost of textbooks has risen 812%, according to this analysis from Mark Perry of the American Enterprise Institute. That is higher than the growth rate for healthcare, real estate, and general consumer prices.

The high costs translate into big business for education publishers as well as textbook renters and re-sellers. They are reluctant to cede that market to the open source movement. That does not mean they are not preparing. The three largest publishers, London-based Pearson, New York-based McGraw-Hill, and Boston-based HoughtonMifflin Harcourt, are all working on digital content strategies. Check out more about that in this great article by Michelle Davis at Education Week.

In terms of the Senate bill to fund textbook creation, I can see a potential problem. I am no hardcore capitalist or anything, but if the funding comes without regard to how often the textbooks are used, then the authors lose some incentive for making engaging, high quality content. They don’t need to be as competitive. That may or may not be a problem. Time will tell.

On the positive side, the increasing use of electronic formats for e-readers and laptops could reduce textbook costs further and expand the reach of free educational content. The benefits could easily overflow the borders of the US, helping students around the world.

At Rukuku, we’ve done our best to make content creation as painless as possible. Our Composer feature allows teachers to simply cut and paste text, graphics, and video into class worksheets.

The trend, regardless of whether this bill passes or not, is toward open resources. Composer can help teachers organize those free resources into class materials. Those materials can then be shared, or possibly even sold, on Rukuku’s Marketplace.

Rock Enroll: Fewer people enroll in post-secondary education

College costs are going up. Everybody’s talking about it, including us. The tricky thing is, if prices are going up, and enrollments are going up, then shouldn’t that be a sign that college is not overpriced. I mean, people are still willing to pay for it. Just simple economics, right?

College, University Enrollment, Students

Enrollment in Post-Secondary Education Falls

It is actually not simple economics, as there are all sorts of arguments on the societal benefits of having a well-educated population as well as arguments that education is not your typical consumer good. I’m not going to get into those in this particular post.

Instead, I am going to highlight an interesting stat released by the US Census Bureau a few weeks back. After more than a decade of rapid growth, college enrollments are going down. In 2012, the total number of students enrolled in college fell by half a million from the year before, according to their figures.

Why did that happen? I don’t know but that’s not going to stop me from pointing out some possibilities.  The most obvious of those is price. As we’ve pointed out before, educational costs grew by 165% from 1993 to 2011, faster than general inflation and medical costs. The pace of increase is slowing, luckily, with prices at public four year universities up only 2.9% in 2012, according to the College Boards.

On the other side of that same coin is the job market. Job prospects are dim and have been for many years. A college degree will make that job search easier, but high school kids are likely shaken by the uncertainty, especially when looking at college price tags and average debt loads.

The prospect of being young and jobless is scary. The prospect of being young and jobless and tens of thousands of dollars in debt is terrifying. The average graduating senior this year was in seventh grade when the economy tanked. That’s a lot of years to let the idea of a crappy job market sink in.

Students over 25 are even more sensitive. In that that group of older students, 419,000 fewer people enrolled in post-secondary education in 2012 than in the year before, accounting for almost 90% of the total decrease in enrollment.

Luckily the continuing conversation over college costs has brought more awareness to the issue. Already, rankings on affordability are becoming more prominent, and colleges are marketing their financial value to prospective students as well as their academic rigor.

Meanwhile, companies like Rukuku are utilizing technology to bring more affordable options to students. This will put even more pressure on the colleges to justify their prices tags.